


Phone:
0086 28 87573647
+86 19150187139

1. Introduction
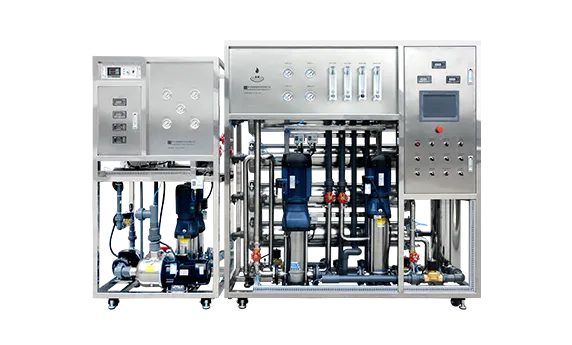
Shandong Zibo Jiazhou Thermal Power Co., Ltd.'s water treatment system is equipped with four 2.5m primary desalination systems, put into operation in 1993, using tap water as the desalination source. Due to limited tap water supply affecting safe production, a new 2×115m³/h reverse osmosis water treatment project was installed in 1998, using surface rainwater accumulated from two reservoirs as the water source. The process is as follows: Reservoir water clarification tank coagulation and sedimentation → valveless filter → fine sand filter → security filter → reverse osmosis → the original primary desalination system.
The reservoir water is heavily polluted and of poor quality due to significant seasonal variations. The pre-RO filtration is simple, lacking activated carbon or other filtration equipment. Sometimes, SDI cannot handle the water, forcing the RO system to shut down; for example, it shut down six times in 1999. Even during normal operation, the reverse osmosis membranes become clogged, requiring frequent cleaning—at least every ten days, and at most once a month. Reverse osmosis membrane cleaning is a highly technical task. Initially, the system was cleaned according to the membrane manufacturer's technical standards, but soon the system output declined and could not be restored to the designed output. To address this deterioration trend, we carefully studied and investigated domestic and international cleaning technologies and experiences. Combining this with our own water treatment process characteristics, we conducted on-site experiments based on water quality changes and pollutant characteristics at different times, searched for effective cleaning formulas, explored and improved process procedures, and standardized operational supervision standards, forming a complete membrane cleaning technology that achieved excellent cleaning results and ensured the safe and stable operation of the RO system.
2. Water Quality Analysis
Monthly analysis of source water quality and weekly analysis of RO influent and effluent are conducted. The water quality indicators are shown in Table 1.
3. Fouling Characteristics and Causes of Reverse Osmosis Membranes
After being put into use, reverse osmosis membranes are subject to fouling by impurities in the water. Due to differences in source water quality and pretreatment methods in different regions, the pollutants in reverse osmosis systems vary, resulting in significant differences in the rate of fouling. Even within the same system, the pollutants are not entirely the same in each cycle, often involving more than one type of pollutant. These pollutants interact, accelerating the fouling rate and increasing the complexity of the fouling, thus increasing the difficulty of cleaning. Common fouling scenarios include the following:
3.1 Colloidal Fouling
Colloidal fouling is a widespread phenomenon. Whether it's groundwater or surface water, it always contains iron-aluminum colloids, silica colloids, and organic colloids. Colloids formed by coagulants, flocculants, and scale inhibitors added during pretreatment can also deposit on the membrane surface, causing colloidal fouling. This increases system quality degradation, reduces permeate flow, and decreases desalination rate.
3.2 Biofouling
Biofouling mainly occurs in surface water treatment systems and systems with frequent start-ups and shutdowns. Single bactericides cannot kill all bacteria and microorganisms in the water. Systems located in dead zones or with prolonged shutdowns allow bacteria and microorganisms to grow and multiply, adhering to the membrane surface and forming a biofilm. This increases the system operating pressure differential, reduces permeate flow, and initially slightly increases desalination rate before decreasing it.
3.3 Chemical Scaling
Chemical scaling often occurs in the second stage, where excessive dissolved salts in the concentrated brine precipitate and form scale. The symptoms include increased pressure drop in the primary section, decreased desalination rate, and reduced output. This can be controlled by adjusting the recovery rate and scale inhibitor dosage.
3.4 Particulate Fouling
Particulate fouling often occurs at the upstream end. The main causes are incomplete flushing during new system commissioning, defects in the security filter allowing corrosive debris such as sludge and fine sand to pass through, the use of wound-wound micron filter cartridges leading to lint shedding, and high operating pressure differentials causing membrane sheets to detach and clog the upstream end of the next membrane. This results in increased pressure drop and reduced output. These are mechanical fouling issues and are preventable.
The general characteristics of membrane fouling are increased pressure differential, reduced output, and decreased desalination rate. So, when is cleaning necessary after fouling?
4. Determining Membrane Cleaning
After membrane fouling, cleaning should be performed when the permeate flow rate decreases by 15% compared to commissioning, the corrected pressure differential change reaches 15%, or the normalized salt flux reaches 15%.
These indicators are conservative, preventative measures. Our tests showed that even when these indicators decreased by 40%, cleaning restored the system to operational levels. Some other units also use preventative cleaning, i.e., monthly cleaning, to maintain membrane cleanliness and ensure safe and stable operation.
5. Contaminant Analysis
5.1 Water Quality Monitoring Analysis
After membrane fouling, the system exhibited increased differential pressure, decreased output, and a slight decrease in desalination rate. This indicates that the main contaminants are colloidal and bacterial/microbial contamination. Based on the RO influent and effluent water quality indicators in Table 1, calculations using material balance theory show that the main contaminants are organic matter, microorganisms, and colloids.
5.2 Physical Analysis
Small plastic pieces or lenses were used as test samples. These were hung on the inlet water end of a pressure vessel in the RO unit. After one cycle or a period of operation, the test pieces were removed, and contaminants were scraped from the pressure vessel wall for analysis. The contaminants were brownish-yellow, sticky, and viscous (resembling dried yellow oil). Burning the sticky glass rod produced a protein-like aroma, and burning it in a tongs pot also produced a protein-like aroma before carbonization. This indicates a high organic content. It does not dissolve in 8% hydrochloric acid solution, only turning grayish-white. The best way to determine its chemical composition is through elemental analysis, but this requires large, sophisticated, and expensive analytical instruments, which most application companies lack the technical capabilities for.
6. A Highly Effective Cleaning Formula is Key to Ensuring Cleaning Quality
Currently, reverse osmosis membrane cleaning formulas are generally provided by the membrane manufacturers and are typically categorized into four main types based on performance: acid washing, alkaline washing, salt washing, and oxidation washing. These formulas are often confidential, with key technologies kept secret, and there are also differences depending on the region and water quality. Therefore, the cleaning effects vary significantly between different units. We selected the most effective formula based on theoretical analysis and on-site testing.
6.1 Theoretical Basis for Formula Selection
Elemental analysis of contaminants is the theoretical basis for selecting a combination formula. Based on the qualitative analysis in the previous section, dozens of domestic and international cleaning agents were screened, and on-site single-component and composite formula cleaning tests were conducted to select the optimal cleaning formula. This is a simple, reliable, and practical method.
6.2 On-site Testing to Determine the Optimal Formula
The selected reagents were adjusted to the required concentration according to the membrane requirements, and the pH value was measured and dispensed into test cups. Equal amounts of the test strips or scraped contaminants were placed in the beakers, and the mixture was heated to the cleaning temperature to observe their dispersion and dissolution. Some reagents dispersed the contaminants into thread-like structures, while others completely peeled off and dissolved them into a solution. Based on these test results, considering the compatibility of the reagents, and analyzing their effects on humans, the RO membrane, and the environment, a scientifically sound and rationally selected optimal composite formula was chosen for RO cleaning, achieving excellent results. In over 50 cleaning tests over two years, we used expensive imported reagents, inexpensive domestic reagents, and low-concentration oxidants to clean the RO membrane. The membrane desalination rate remained the same as when it was first put into operation, at 97.5%, indicating that the cleaning was effective and successful.
7. Experimental Study on the Influence of Cleaning Process on Cleaning Effect
After determining the cleaning formula, the cleaning process and operation are the effective guarantees for ensuring cleaning quality. Therefore, we conducted numerous comparative experiments in this large on-site laboratory to identify the optimal cleaning process and operation method.
7.1 Comparison of Co-current and Counter-current Cleaning Experiments
Co-current cleaning is a cleaning method where the cleaning agent flows in the same direction as the running water flow. Counter-current cleaning is a cleaning method where the cleaning solution flows in the opposite direction to the running water flow. Co-current cleaning is a commonly used cleaning process and is more effective at cleaning colloidal and scale-based fouling. This is because these two substances are easily chemically dissolved, and scale mainly forms in the second section, so after dissolving, it is easily flushed out with the water flow. Our membrane fouling mainly occurs in the first two membranes of each pipe in the first section, primarily due to cross-contamination between organic and colloidal substances. The role of the cleaning agent is mainly to peel and disperse the fouling, not to completely dissolve it. During counter-current cleaning, the dispersed and dissolved fouling travels a much shorter distance with the water flow than during co-current cleaning, resulting in a faster flushing speed. Therefore, counter-current cleaning is relatively more effective than co-current cleaning.
7.2 Comparison of Segmented Cleaning and Mixed Cleaning Effects
The membrane manufacturer requires segmented cleaning, with each segment requiring a fresh cleaning agent. This is to prevent cross-contamination. Based on this, a mixed cleaning experiment was conducted, using the same cleaning agent to alternately clean the first and second segments in a series. Multiple cleaning tests proved that the cleaning effect was comparable, and it was more time-saving, labor-saving, and cost-effective. We currently use the mixed cleaning method.
7.3 Comparison of Single Cleaning and Composite Cleaning Experiments
Single acid washing, alkaline washing, and composite cleaning experiments were conducted on the RO membrane. Composite cleaning involves two aspects: first, a compound formulation of cleaning agents; second, acid washing, alkaline washing, oxidation, complexation, and sterilization are carried out step by step. The experiments showed that composite cleaning was more effective than single cleaning (see Table 2). This is because membrane fouling is complex. The top layer is usually adhered particles, colloids, and biological matter; the second layer is deposited salts and metal compounds such as iron and aluminum; and the third layer closest to the membrane is usually cross-linked complex silicates and complexed organic matter. Only by combining acid washing, alkali washing, and complexation cleaning processes into a composite cleaning solution can the desired effect be achieved.
7.4 Comparison of Dynamic Cleaning and Alternating Dynamic-Static Cleaning
Dynamic cleaning involves continuous cleaning in a flowing state until completion. Alternating dynamic-static cleaning involves adjusting the temperature and pH value during the flowing state, followed by a period of static immersion. Experiments show that alternating dynamic-static cleaning is more effective than single dynamic cleaning. This is because in single dynamic cleaning, the detached contaminants are pressed into the corners of the grid, creating dead zones and increasing the time for dispersion and dissolution. During static immersion, the compacted contaminants are released back into the cleaning solution, accelerating the reaction and dissolution. Alternating dynamic-static cleaning, combined with mixed cleaning, saves time, labor, and money while achieving good results.
7.5 Comparison of Single-Pipe Cleaning and Overall Cleaning
Single-pipe cleaning involves detaching a pressure vessel from a specific section (stage) and cleaning the membrane within that pipe. This cleaning method is more effective than overall cleaning because the control of parameters such as reagent concentration and flow rate is reliable. This method does not affect production; it only slightly reduces system output. However, the cleaning time was too long. Additionally, we developed a single-membrane cleaning process to address the severe organic contamination and large pressure drop of the first membrane before each tube in the RO section. This process removes the first membrane from each tube in one go, cleans and tests its performance indicators, and then reinstalls it from the end, with good results.
8. Experiments on the Influence of Cleaning Technical Parameter Control on Cleaning Quality
8.1 Experimental Exploration of the Effects of Cleaning Temperature and pH on Cleaning Effectiveness
Cleansing temperature and pH directly affect the chemical stability of the membrane and the cleaning effect. Higher temperatures accelerate chemical reactions and improve cleaning quality, but also increase membrane solubility. Lower temperatures result in poorer effects. For DOW membranes, maintaining a temperature between 35 and 40°C has no effect on the membrane and significantly improves the cleaning effect. Higher pH values are beneficial for cleaning organic matter and microorganisms, while lower pH values are beneficial for cleaning scale and metal oxides. When DOW company technicians provided on-site guidance, they suggested that we relax the pH value requirements by 0.5-1.0 units beyond their specified range. Experiments showed that increased acidity or alkalinity improved cleaning quality. After more than two years of operation and dozens of cleanings, the membrane desalination rate has consistently remained at 97.5% of the initial target, indicating that the cleaning parameters are well-controlled and safe.
8.2 Exploring the Relationship between Cleaning Flow Rate, Pressure Difference, and Cleaning Effectiveness
The principle of cleaning should be a low-pressure-difference, high-flux cleaning method, with the average pressure drop of a single membrane controlled within 0.06 MPa. Low cleaning flow rates lead to flow deviation and dead zones, while high flow rates can easily damage the membrane. Experiments have shown that a cleaning flow rate of 1.0-1.2 times the operating flow rate is most suitable. Under the action of the cleaning agent, this flow rate ensures that contaminants adhering to the membrane surface and network during normal operation fully contact the cleaning agent, react, dissolve, disperse, and are flushed away, without dead zones or flow deviation, resulting in good cleaning effectiveness.
9. Cleaning Supervision and Effectiveness Evaluation
During the cleaning process, it is essential to carefully monitor the system pressure drop, cleaning flow rate, temperature, and analyze and monitor changes in the cleaning solution concentration, pH value, and color. These should be strictly controlled within the specified ranges. Cleaning is considered complete when the cleaning agent concentration or pH value remains stable for two consecutive measurements. Then, the entire system is sterilized using bactericides such as formaldehyde or isoxazolinone.
After commissioning, the cleaning effect is evaluated. The pressure, flow rate, and desalination rate of each section are compared to the standard conditions at the time of commissioning in the previous cycle. The desalination rate should remain unchanged; a difference of less than 2% in output is ideal. If the difference exceeds 3%, the formula should be adjusted for the next cleaning, and cleaning parameters should be strictly controlled.
10. Conclusion
Reverse osmosis membrane cleaning uses a composite cleaning method combined with sterilization treatment, resulting in good effects and ensuring a smooth operating cycle.
For reverse osmosis treatment of surface water, the focus should be on proper pretreatment to reduce cleaning frequency and extend membrane lifespan. We are currently exploring new and effective agents to enhance coagulation and sterilization treatment. The valveless filter has been replaced with a dual-media filter using anthracite and quartz sand. We are also preparing to add activated carbon filters to achieve the above objectives.
Scientific selection of osmosis membranes reduces the frequency of cleaning and ensures safe production. The BW-30-400 membrane is not suitable for our surface water treatment application. Research on membrane users both domestically and internationally suggests that surface water treatment requires membranes with larger channels, higher smoothness, electroneutrality, and hydrophilicity to slow down fouling and extend operating cycles and lifespan.
Membrane cleaning is a relatively new technology, and membrane fouling is highly localized to specific water sources. Continuous exploration and improvement in both theory and practice are needed to develop a standardized cleaning technique to ensure the safe and stable operation of the membrane.