


Phone:
0086 28 87573647
+86 19150187139

Since the 1970s, our institute has successfully treated radioactive wastewater using two processes: "four electrodialysis units" and "electrodialysis unit-packed bed electrodialysis unit". However, we have also found that the treatment effect on radioactive wastewater discharged from our institute's radiochemistry laboratory is not ideal. This is mainly because the wastewater has a complex composition, especially containing organic macromolecules and complexes, which are difficult to remove by electrodialysis, thus affecting the purification effect [2].
In recent years, we have developed YM-type sulfonated polysulfone ultrafiltration membranes and conducted exploratory experiments on ultrafiltration membrane treatment of radioactive wastewater [3]. We have also studied the method of reverse osmosis treatment of radioactive wastewater [4]. Based on this, and combining the advantages of various treatment methods, we have proposed a new process for treating low-level radioactive wastewater using a combination of ultrafiltration (UF)-reverse osmosis (RO)-electrodialysis (ED) process (hereinafter referred to as URE process).
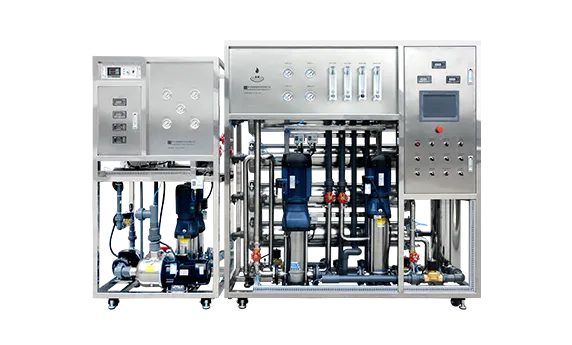
The system utilizes a YM-type internal pressure tubular ultrafiltration unit (sulfonated polysulfone ultrafiltration membrane, molecular weight cutoff of 20,000) developed by our institute, with a membrane area of 1.5 m², a pure water flux of 250 L/h (pressure 0.25 MPa). The reverse osmosis unit is an HRC-type hollow fiber module developed by the Second Institute of Oceanography, with a membrane area of 40 m², a pure water flux of 270 L/h (pressure 1.3 MPa). The electrodialysis unit is 400 mm × 800 mm, single-stage, with 40 membrane pairs, assembled by our institute.
Low-level wastewater discharged from the radiochemistry laboratory enters a settling tank. After 24 hours of settling, the supernatant is transferred to the ultrafiltration raw water tank. After ultrafiltration treatment, the permeate enters the intermediate tank. Simultaneously, the reverse osmosis unit and electrodialysis unit are started. The reverse osmosis unit further desalinates and removes contaminants; the permeate can be directly discharged or flow into a mixed bed for further treatment. Electrodialysis serves a concentration function. The final concentrates from ultrafiltration and electrodialysis are retained for solidification treatment. All three units operate in a circulating manner.
The cold test ran for a total of 147.5 hours, treating a total of 14 m³ of simulated wastewater. The simulated wastewater was prepared according to the actual radioactive wastewater composition,
specifically: NaHCO3 60 mg/L, NaNO3 146 mg/L, NaCl 128 mg/L, CaCl2 88 mg/L, MgCl2 71 mg/L,
Na2SO4 7 mg/L, 30% TBP-kerosene 50 mg/L, machine oil 50 mg/L, detergent 50 mg/L. The cold test operation is described below:
Ultrafiltration Unit
In the URE process, UF serves as pretreatment to remove most organic matter and macromolecules to ensure the RO feed water requirements and improve the ED concentration effect.
Desalination Effect
Unlike ordinary ultrafiltration membranes, sulfonated polysulfone ultrafiltration membranes are charged and therefore have a certain desalination capacity. However, the desalination rate decreases with increasing salt content and decreasing pH in the raw water (Table 1).
Table 1 Effects of raw water salt content and pH on desalination rate
Raw water salinity (mg/L) | Raw water pH value | Osmotic fluid salinity (mg/L) | Desalination rate (%) |
980 | 6 | 899 | 8.3 |
1010 | 5 | 938 | 7.1 |
1050 | 4 | 1000 | 4.8 |
Factors affecting flux
The composition, concentration, and temperature of the raw water all affect the flux of the microfluidic reactor (UF). The fluxes when the raw water contains no organic matter (i.e., no added oil, detergent, etc.) and when it contains organic matter are 73.87 L/m²h and 58.30 L/m²h, respectively. Furthermore, the flux gradually decreases as the feed concentration increases, while the flux gradually increases as the feed temperature increases.
Changes in turbidity and chemical oxygen demand
After ultrafiltration, the turbidity of the wastewater was significantly reduced, ensuring the feed water requirements for reverse osmosis. The decrease in the COD value of the wastewater indicates that most of the organic matter has been removed, making downstream treatment processes easier (Table 2).
Table 2. Changes in turbidity and COD values
Raw water turbidity (mg/L) | Osmotic turbidity (mg/L) | Average turbidity removal rate (%) | COD of raw water (mg/L) | Osmotic COD (mg/L) | Average COD decrease rate (%) |
66~1575 | 0~1 | 99.9 | 248~1428 | 65~87 | 80.2 |
(4) Membrane cleaning method test
As the operating time increased, the ultrafiltration flux gradually decreased. The experiment used chemical cleaning, mechanical cleaning with sea balls, and a combination of these methods to clean the filter and restore the flux.
Chemical cleaning can effectively restore flux, but flux decays rapidly upon restarting and generates waste liquid twice. Mechanical cleaning with sea-surface balls, on the other hand, involves simply rotating the ball-washing valve 180 degrees, allowing the sea-surface balls stored inside to enter the membrane along with the feed solution. After scrubbing the membrane surface, the sea-surface balls return to the valve for later use. While the initial flux after cleaning is not as high as with chemical cleaning, it remains stable for a longer period. This method is simple, does not disrupt production, and does not generate waste liquid twice, making it suitable for treating radioactive wastewater.
Flux after chemical cleaning;
Flux after chemical cleaning followed by ball washing;
Flux after ball washing
Reverse osmosis unit
In the URE process, RO is used for deep purification. The experiment explored the location of RO in the process and other influencing factors.
The position of reverse osmosis in the URE process
Initially, the URE process was envisioned as UF-RO-ED, where wastewater, after ultrafiltration, would enter reverse osmosis for desalination and concentration by a factor of two, followed by further concentration via electrodialysis. However, experiments revealed that as the salt content of the reverse osmosis feed solution increased due to concentration, the desalination rate decreased, and the salt content of the permeate also increased, burdening the downstream treatment. To better utilize reverse osmosis, the process was changed to UF-ED-RO, where the ultrafiltration-treated feed solution is first desalinated via electrodialysis to reduce the salt content to 500 mg/L, before further desalination via reverse osmosis. After this modification, the reverse osmosis desalination rate stabilized at 85%.
Flux Change
During the initial 40 hours of operation, the RO flux decreased from 141 L/h to 112 L/h (1.3 MPa), but remained relatively stable for the next 100+ hours without further decline. This can be attributed to the significantly reduced fouling of the RO membrane due to the use of UF as a pretreatment method. The initial flux decrease was caused by the membrane compaction effect.
Electrodialysis and ion exchange units
Electrodialysis and ion exchange are mainly used for concentration and subsequent deep purification in the URE process, respectively (Tables 3 and 4).
Table 3. Results of cold tests on electrodialysis and ion exchange units
Process unit | Salt content of feed liquid (mg/L) | Salt content of exudate (mg/L) | Desalination rate % | Salt content of the most concentrated water (mg/L) | Concentration factor | Current efficiency % |
Electrodialysis | 1510 | 1342 | 11.1 | 7.5×10⁴ | 49.7 | 45.2 |
Ion exchange | 280 | 1 | 99.6 |
Table 4 Summary of URE process cold test results
Process unit | Average throughput (L/h) | Average desalination rate (%) | Average COD decrease rate (%) | Concentration factor | volume* Concentration ratio |
Ultrafiltration | 70 | 6.9 | 80 | 56 | |
Reverse osmosis | 90 | 85.7 | 82.5 | ||
Electrodialysis | 75 | 11.1 | 49.7 | ||
Ion exchange | 90 | 99.6 | |||
Total | 99.9 | 93.6 | 49.7 | 46.7 |
*Volume concentration ratio = Feed liquid volume / Concentrated sludge volume
Based on the full-process cold test operation, a low-level radioactive wastewater treatment experiment was conducted. The low-level radioactive wastewater came from actual wastewater from the institute's radiochemistry laboratory, with a specific radioactivity level of 7.4 kBq/L, mainly containing 90Sr-90Y and 137Cs radionuclides, and a salinity of 800 mg/L. To further verify the membrane's ability to remove organic matter, the same organic components as in the cold test were added to the wastewater. The hot test ran for a total of 104.5 hours, treating 7.5 m³ of radioactive wastewater. The effect of the influent concentration of the reverse osmosis unit on desalination and decontamination was further measured during the experiment, and the removal of high-valence ions was also analyzed.
The impact of raw water salinity on the decontamination rate of the reverse osmosis unit
Similar to the cold test results, when the raw water has a high salt content, the RO desalination rate decreases, and the decontamination rate also decreases. By starting the ED first, and keeping the salt content of the RO feed liquid at around 500 mg/L, the RO desalination rate can reach over 90%, and the decontamination rate can also be increased to over 95% (Table 5).
Table 5. Effect of raw water salinity on the decontamination rate of the reverse osmosis unit.
Raw water salinity (mg/L) | Osmotic fluid salinity (mg/L) | Desalination rate (%) | Raw water radioactivity count (cpm) | Radioactivity count of permeate (cpm) | Decontamination rate (%) |
1650 | 860 | 47.9 | 6.54 | 0.50 | 92.4 |
445.4 | 48.2 | 89.2 | 7.16 | 0.20 | 97.2 |
Removal effect on high-valence ions
The removal rates of Ca2+ and Fe3+ ions in wastewater by UF and RO were determined in the thermal test (Table 6).
The results showed that both UF and RO had higher removal rates for divalent ions than for mixed ions. The removal rate for iron ions with complex and high valence states was close to 100%, indicating that membrane separation is extremely effective in removing complex, high-valence ions.
Table 6. Removal efficiency of ultrafiltration and reverse osmosis for Ca2+ and Fe3+
Process unit | Raw water mixed ion content (mg/L) | Osmotic fluid mixed ion content (mg/L) | Mixed ion removal rate (%) | raw water Ca2+ content (mg/L) | Osmotic Ca2+ content (mg/L) | Ca2+ removal rate (%) | raw water Fe3+ content (mg/L) | Permeate Fe3+ content (mg/L) | Fe3+ removal rate (%) |
Ultrafiltration | 740 | 660 | 10.8 | 57.8 | 46.4 | 19.7 | 0.13 | 0 | ~100 |
Reverse osmosis | 445.2 | 48.2 | 89.2 | 22.9 | 1.14 | 95.0 | 0.23 | 0 | ~100 |
Overall stain removal effect
During the full-process hot commissioning, total β was measured using a β-weak radioactivity measuring device, and total γ was measured using an HP-Ge probe S-85 multichannel analyzer system. Samples were taken and measured every 2 hours. The decontamination effect of the URE process and the results of 3H measurement using thermoluminescence method are shown in Table 7.
The results of the URE process thermal test show that radioactivity removal mainly relies on reverse osmosis (total β and total γ removal rates are 95.0% and 93.7%, respectively). This process has no effect on 3H removal. The highest dose accumulation in the table was measured periodically using a β-γ radiation meter within a fixed area of the ultrafiltration and reverse osmosis units. The highest dose during the thermal test never exceeded 7.74 × 10⁻⁶ c/kg, indicating that the ultrafiltration and reverse osmosis units do not cause dose accumulation.
Full-process evaluation
Based on the results of the cold and hot tests throughout the entire process, the URE process is evaluated as follows:
Ultrafiltration replaces the coagulation and sedimentation process in the original process, reducing the need for solid waste disposal equipment, resulting in a high wastewater volume reduction ratio, stable operation, and ease of operation. Ultrafiltration significantly removes organic matter from wastewater, producing low effluent turbidity, meeting the feed water requirements of reverse osmosis, and improving the purification effect of downstream processes. Mechanical cleaning with sponge balls can appropriately restore the flux, without affecting production or generating secondary wastewater.
Table 7. Decontamination effect of URE process
Process unit | Desalination rate (%) | Total β specific emission (Bq/L) × 10³ Inlet liquid outlet liquid | Total β Stain removal rate (%) Stain removal factor | Total γ (Bq/L) Inlet liquid outlet liquid | |||
Ultrafiltration | 9 | 8.88 | 5.74 | 35.4 | 1.5 | 190 | 170 |
Reverse osmosis | 84.9 | 2.28 | 0.114 | 95.0 | 20.0 | 58.50 | 3.70 |
Electrodialysis | 18.8 | 2.30 | 1.35 | 41.3 | 1.7 | 58.50 | 44.40 |
Ion exchange | 98.4 | 0.144 | 0.00276 | 98.1 | 52.2 | 3.70 | 0.81 |
URE process | 99.83 | 99.97 | 3200 | ||||
Process unit | Total γ Stain removal rate (%) Stain removal factor | Concentrate multiple | Highest dose Rate accumulation (c/kg)×10-6 | Leakage from each unit 3H ratio (Bq/L)×10⁶ | |
Ultrafiltration | 10.5 | 1.1 | 11.8 | 7.74 | 4.81 |
Reverse osmosis | 93.7 | 15.8 | 7.74 | 4.66 | |
Electrodialysis | 24.1 | 1.3 | 45.8 | 4.88 | |
Ion exchange | 78.1 | 4.6 | 4.66 | ||
URE process | 99.57 | 234.6 | 45.8 | ||
*The 3H ratio of the raw water is 4.77 × 10⁶, and the 3H ratio of the most concentrated water is 4.55 × 10⁶.
Reverse osmosis significantly improves desalination efficiency compared to electrodialysis and packed-bed electrodialysis (Table 8). In practical applications, the installation and operation of reverse osmosis are much simpler than those of electrodialysis or packed-bed electrodialysis. Reverse osmosis can remove not only ions but also complex macromolecules, thus improving purification efficiency. The reverse osmosis unit used in this experiment was a low-pressure type, which experienced a decrease in desalination and decontamination rates as the salt content increased. Future experiments using high-pressure or medium-pressure reverse osmosis units could overcome this weakness and further improve desalination and decontamination capabilities, eliminating the need for subsequent ion exchange units and simplifying the process.
Table 8 Comparison of decontamination effects between electrodialysis and reverse osmosis
Equipment Name | Desalination rate (%) | Discharge ratio (Bq/L) | Decontaminant |
Desalination electrodialysis unit (two units in series) | 98.4 | 140.6 | 39.0 |
Desalination electrodialysis unit (third unit) | 97.0 | 66.6 | 2.1 |
Packed bed electrodialysis unit | 99.6 | 62.9 | 16.3 |
Reverse osmosis | 84.9 | 113.9 | 20.0 |
(3) A comparison was made between the processes of four electrodialysis units, the electrodialysis-packed bed electrodialysis unit, and the URE process in treating wastewater from the radiochemistry laboratory of this institute. Obviously, the URE process has a higher decontamination capacity (Table 9).
Table 9 Comparison of the decontamination effects of three processes for treating low-level radioactive wastewater
Process Name | Wastewater discharge ratio (Bq/L) | Decontaminant | Concentration factor |
Four electrodialysis units | 4.59×10³ | 72 | >100 |
Electrodialysis - Packed Bed Electrodialysis Unit | 1.75×10⁴ | 280 | >100 |
URE | 8.88×10³ | 3200 | 45.8 |