


Phone:
0086 28 87573647
+86 19150187139

The report indicated that from January to March 2019, all 1,940 national assessment sections adopted a separate sampling and testing model for monitoring. Monitoring was actually conducted at 1,861 sections, while the remaining 79 sections were not monitored due to reasons such as flow interruption, traffic disruptions, or the inability to sample during the ice-melting period.
I. Overall Water Quality Status
In March 2019, among the 1,940 national surface water assessment sections (1,788 actually measured), the proportion of sections with excellent water quality (Class I-III) was 74.3%, an increase of 5.8 percentage points year-on-year; the proportion of sections with water quality worse than Class V was 5.5%, a decrease of 3.1 percentage points year-on-year. The main pollutants were total phosphorus, chemical oxygen demand (COD), and ammonia nitrogen.
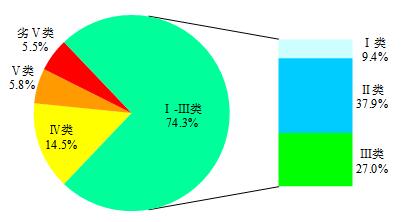
National Surface Water Quality Classification Proportions, March 2019
From January to March 2019, among 1940 national surface water assessment sections, the proportion of sections with excellent water quality (Class I-III) was 74.3%, an increase of 8.0 percentage points year-on-year; the proportion of sections with water quality worse than Class V was 6.0%, a decrease of 3.6 percentage points year-on-year. The main pollutants were ammonia nitrogen, total phosphorus, and chemical oxygen demand (COD).
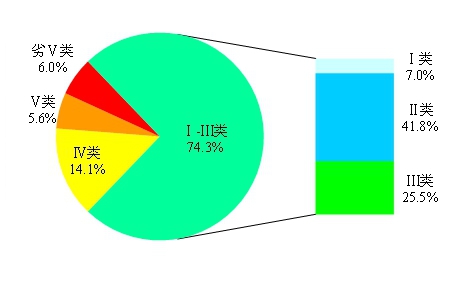
National Surface Water Quality Classification Proportions, January-March 2019
II. Water Quality Status of Various River Basins
In March 2019, the proportion of Class I-III water quality sections in the seven major river basins (Yangtze, Yellow, Pearl, Songhua, Huai, Hai, and Liao rivers), as well as rivers in Northwest China, Southwest China, and the Zhejiang-Fujian region, was 75.4%, an increase of 3.4 percentage points year-on-year; the proportion of sections with water quality worse than Class V was 5.8%, a decrease of 3.2 percentage points year-on-year. The main pollutants were ammonia nitrogen, COD, and five-day biochemical oxygen demand (BOD5). The water quality of rivers in Southwest and Northwest China was excellent; the water quality of the Yangtze River Basin, the rivers in the Zhejiang-Fujian region, and the Pearl River Basin was good; and the water quality of the Huai River, Songhua River, Yellow River, Liao River, and Hai River Basins was slightly polluted.
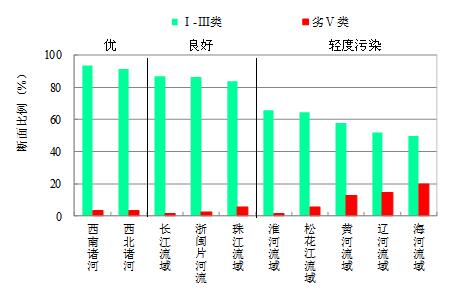
Water Quality Classification Proportions of the Seven Major River Basins and Rivers in Southwest, Northwest, and Zhejiang-Fujian Regions in March 2019
From January to March, the proportion of sections with water quality of Class I-III in the seven major river basins (Yangtze, Yellow, Pearl, Songhua, Huai, Hai, and Liao Rivers) and rivers in Northwest, Southwest, and Zhejiang-Fujian regions was 76.3%, an increase of 6.6 percentage points year-on-year; the proportion of sections with water quality worse than Class V was 6.7%, a decrease of 3.3 percentage points year-on-year. The main pollutants were ammonia nitrogen, chemical oxygen demand (COD), and five-day biochemical oxygen demand (BOD5). Specifically, the water quality of rivers in Northwest, Southwest, and Zhejiang-Fujian regions was excellent; the water quality of the Yangtze and Pearl River Basins was good; the water quality of the Songhua River, Yellow River, Huai River, and Hai River Basins was slightly polluted; and the water quality of the Liao River Basin was moderately polluted.
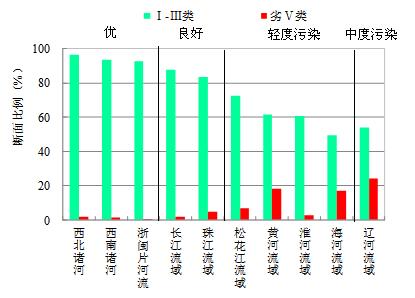
Water Quality Classification Proportions of Seven Major River Basins, Rivers in Southwest and Northwest China, and Rivers in the Zhejiang-Fujian Area, January-March 2019
III. Water Quality and Tropical Status of Important Lakes (Reservoirs)
In March 2019, among the 97 key lakes (reservoirs) monitored, the proportion of lakes and reservoirs with water quality of Class I-III was 78.4%, an increase of 14.9 percentage points year-on-year; the proportion of lakes and reservoirs with water quality worse than Class V was 4.1%, a decrease of 2.6 percentage points year-on-year. The main pollutants were total phosphorus, chemical oxygen demand, and permanganate index. Among the 95 key lakes (reservoirs) monitored for eutrophication, 1 lake (reservoir) was severely eutrophic, accounting for 1.1%; 2 lakes (reservoirs) were moderately eutrophic, accounting for 2.1%; 14 lakes (reservoirs) were slightly eutrophic, accounting for 14.7%; the remaining lakes (reservoirs) did not show eutrophication. Among them, Taihu Lake is slightly polluted and slightly eutrophic, with total phosphorus as the main pollutant; Chaohu Lake has good water quality and is mesotrophic; Dianchi Lake is slightly polluted and slightly eutrophic, with total phosphorus and chemical oxygen demand (COD) as the main pollutants. Erhai Lake has excellent water quality and is mesotrophic; Danjiangkou Reservoir has excellent water quality and is mesotrophic; Baiyangdian Lake is slightly polluted and slightly eutrophic, with total phosphorus as the main pollutant.
From January to March, among the 98 key lakes (reservoirs) monitored, the proportion of lakes and reservoirs with water quality of Class I-III was 72.4%, an increase of 7.3 percentage points year-on-year; the proportion of lakes and reservoirs with water quality worse than Class V was 3.1%, a decrease of 5.4 percentage points year-on-year. The main pollutants affecting the water quality of lakes (reservoirs) were total phosphorus, COD, and pH. Of the 96 key lakes (reservoirs) monitored for eutrophication, 2 lakes (reservoirs) were moderately eutrophic, accounting for 2.1%; 18 lakes (reservoirs) were slightly eutrophic, accounting for 18.8%; the remaining lakes (reservoirs) did not show eutrophication. Specifically, Taihu Lake was slightly polluted and slightly eutrophic, with total phosphorus as the main pollutant; Chaohu Lake was slightly polluted and slightly eutrophic, with total phosphorus as the main pollutant; Dianchi Lake was slightly polluted and slightly eutrophic, with chemical oxygen demand and total phosphorus as the main pollutants. Erhai Lake had good water quality and was mesotrophic; Danjiangkou Reservoir had excellent water quality and was mesotrophic; Baiyangdian Lake was slightly polluted and slightly eutrophic, with total phosphorus as the main pollutant.
IV. Ranking of National Surface Water Assessment Sections in Prefecture-level and Above Cities
The ranking included 2050 national surface water assessment sections in prefecture-level and above cities nationwide (of which 1940 were national surface water evaluation sections and 110 were sea-flow control sections). From January to March 2019, among prefecture-level and above cities nationwide, 30 cities including Ya'an, Laibin, and Yunfu had relatively good water quality at national surface water assessment sections (ranked 1st to 30th), while 30 cities including Lüliang, Yingkou, and Xingtai had relatively poor water quality at national surface water assessment sections (ranked 1st to 30th from the bottom). Furthermore, 30 cities including Siping, Changchun, and Zhongshan showed relatively good changes in water quality at national surface water assessment sections (ranked 1st to 30th), while 30 cities including Lüliang, Yingkou, and Shuozhou showed relatively poor changes in water quality at national surface water assessment sections (ranked 1st to 30th from the bottom).